design Portfolio
I have always enjoyed graphic design. Coupling that with my passion for science communication has lead to creating infographics. I use Inkscape but I am also proficient in Abobe Photoshop and Illustrator. Only the first two of the images below were done as part of funded grants, and I believe the others could be improved if I had time allocated to doing so. If you would like to use the following or would like me to create something for you, please contact me.

A timeline I created to display the key knowledge sharing events during a research project. This was part of the final report I wrote with the team.
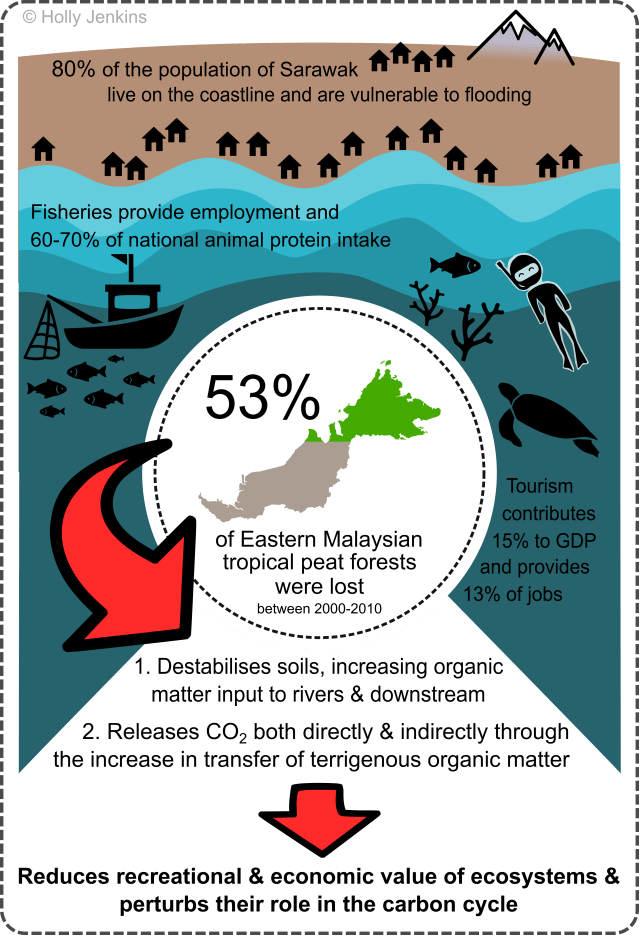
An infographic for about the challenges facing Eastern Malaysia. This was again part of the final report for that project.
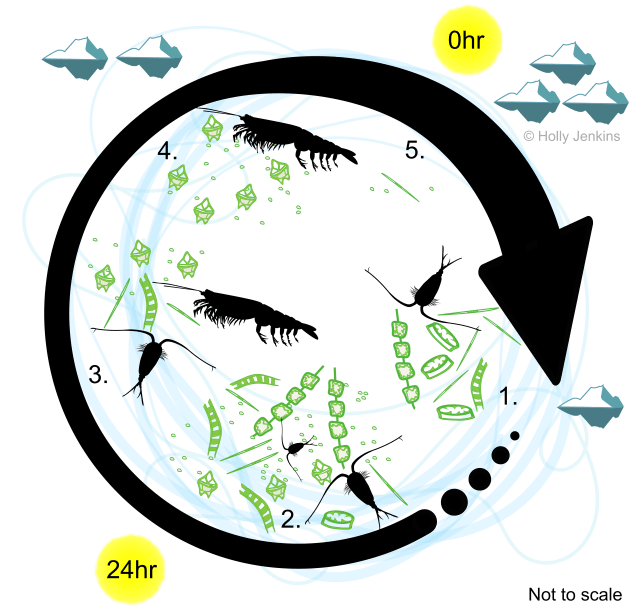
Arctic seasonality in terms of phytoplankton, zooplankton and ice extent.

Contributions to the new British Antarctic Survey map of the Arctic.

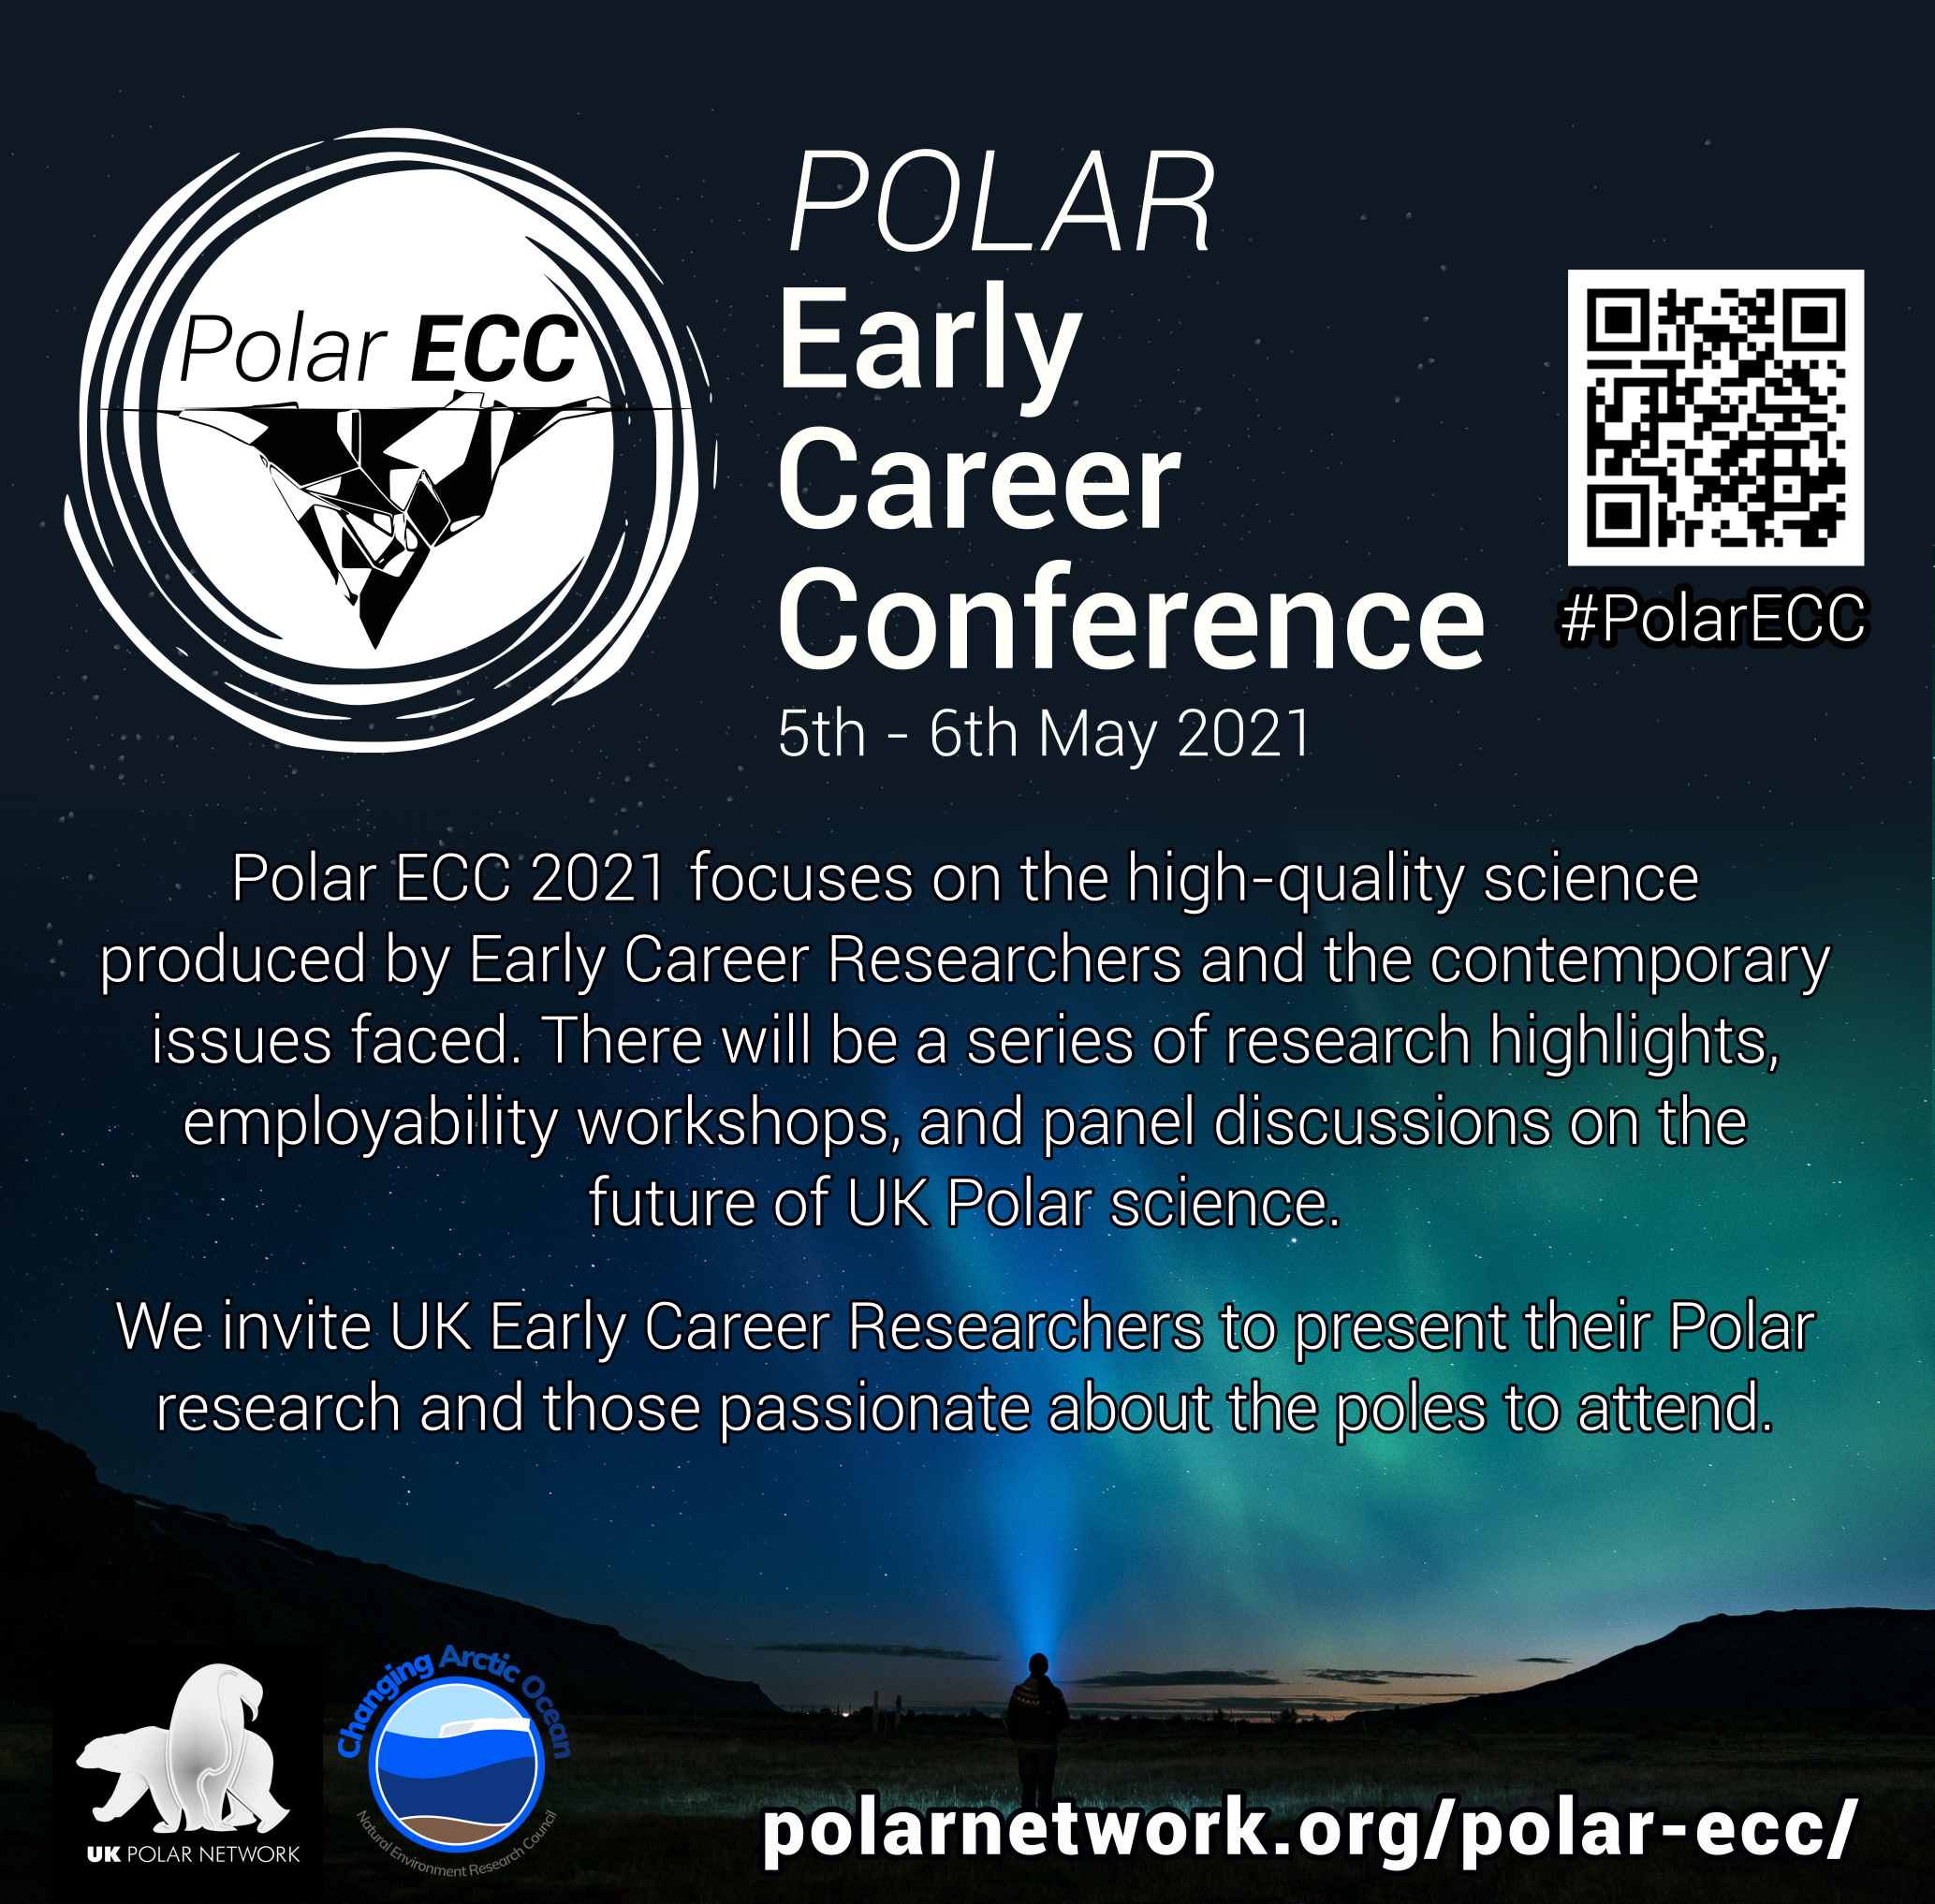

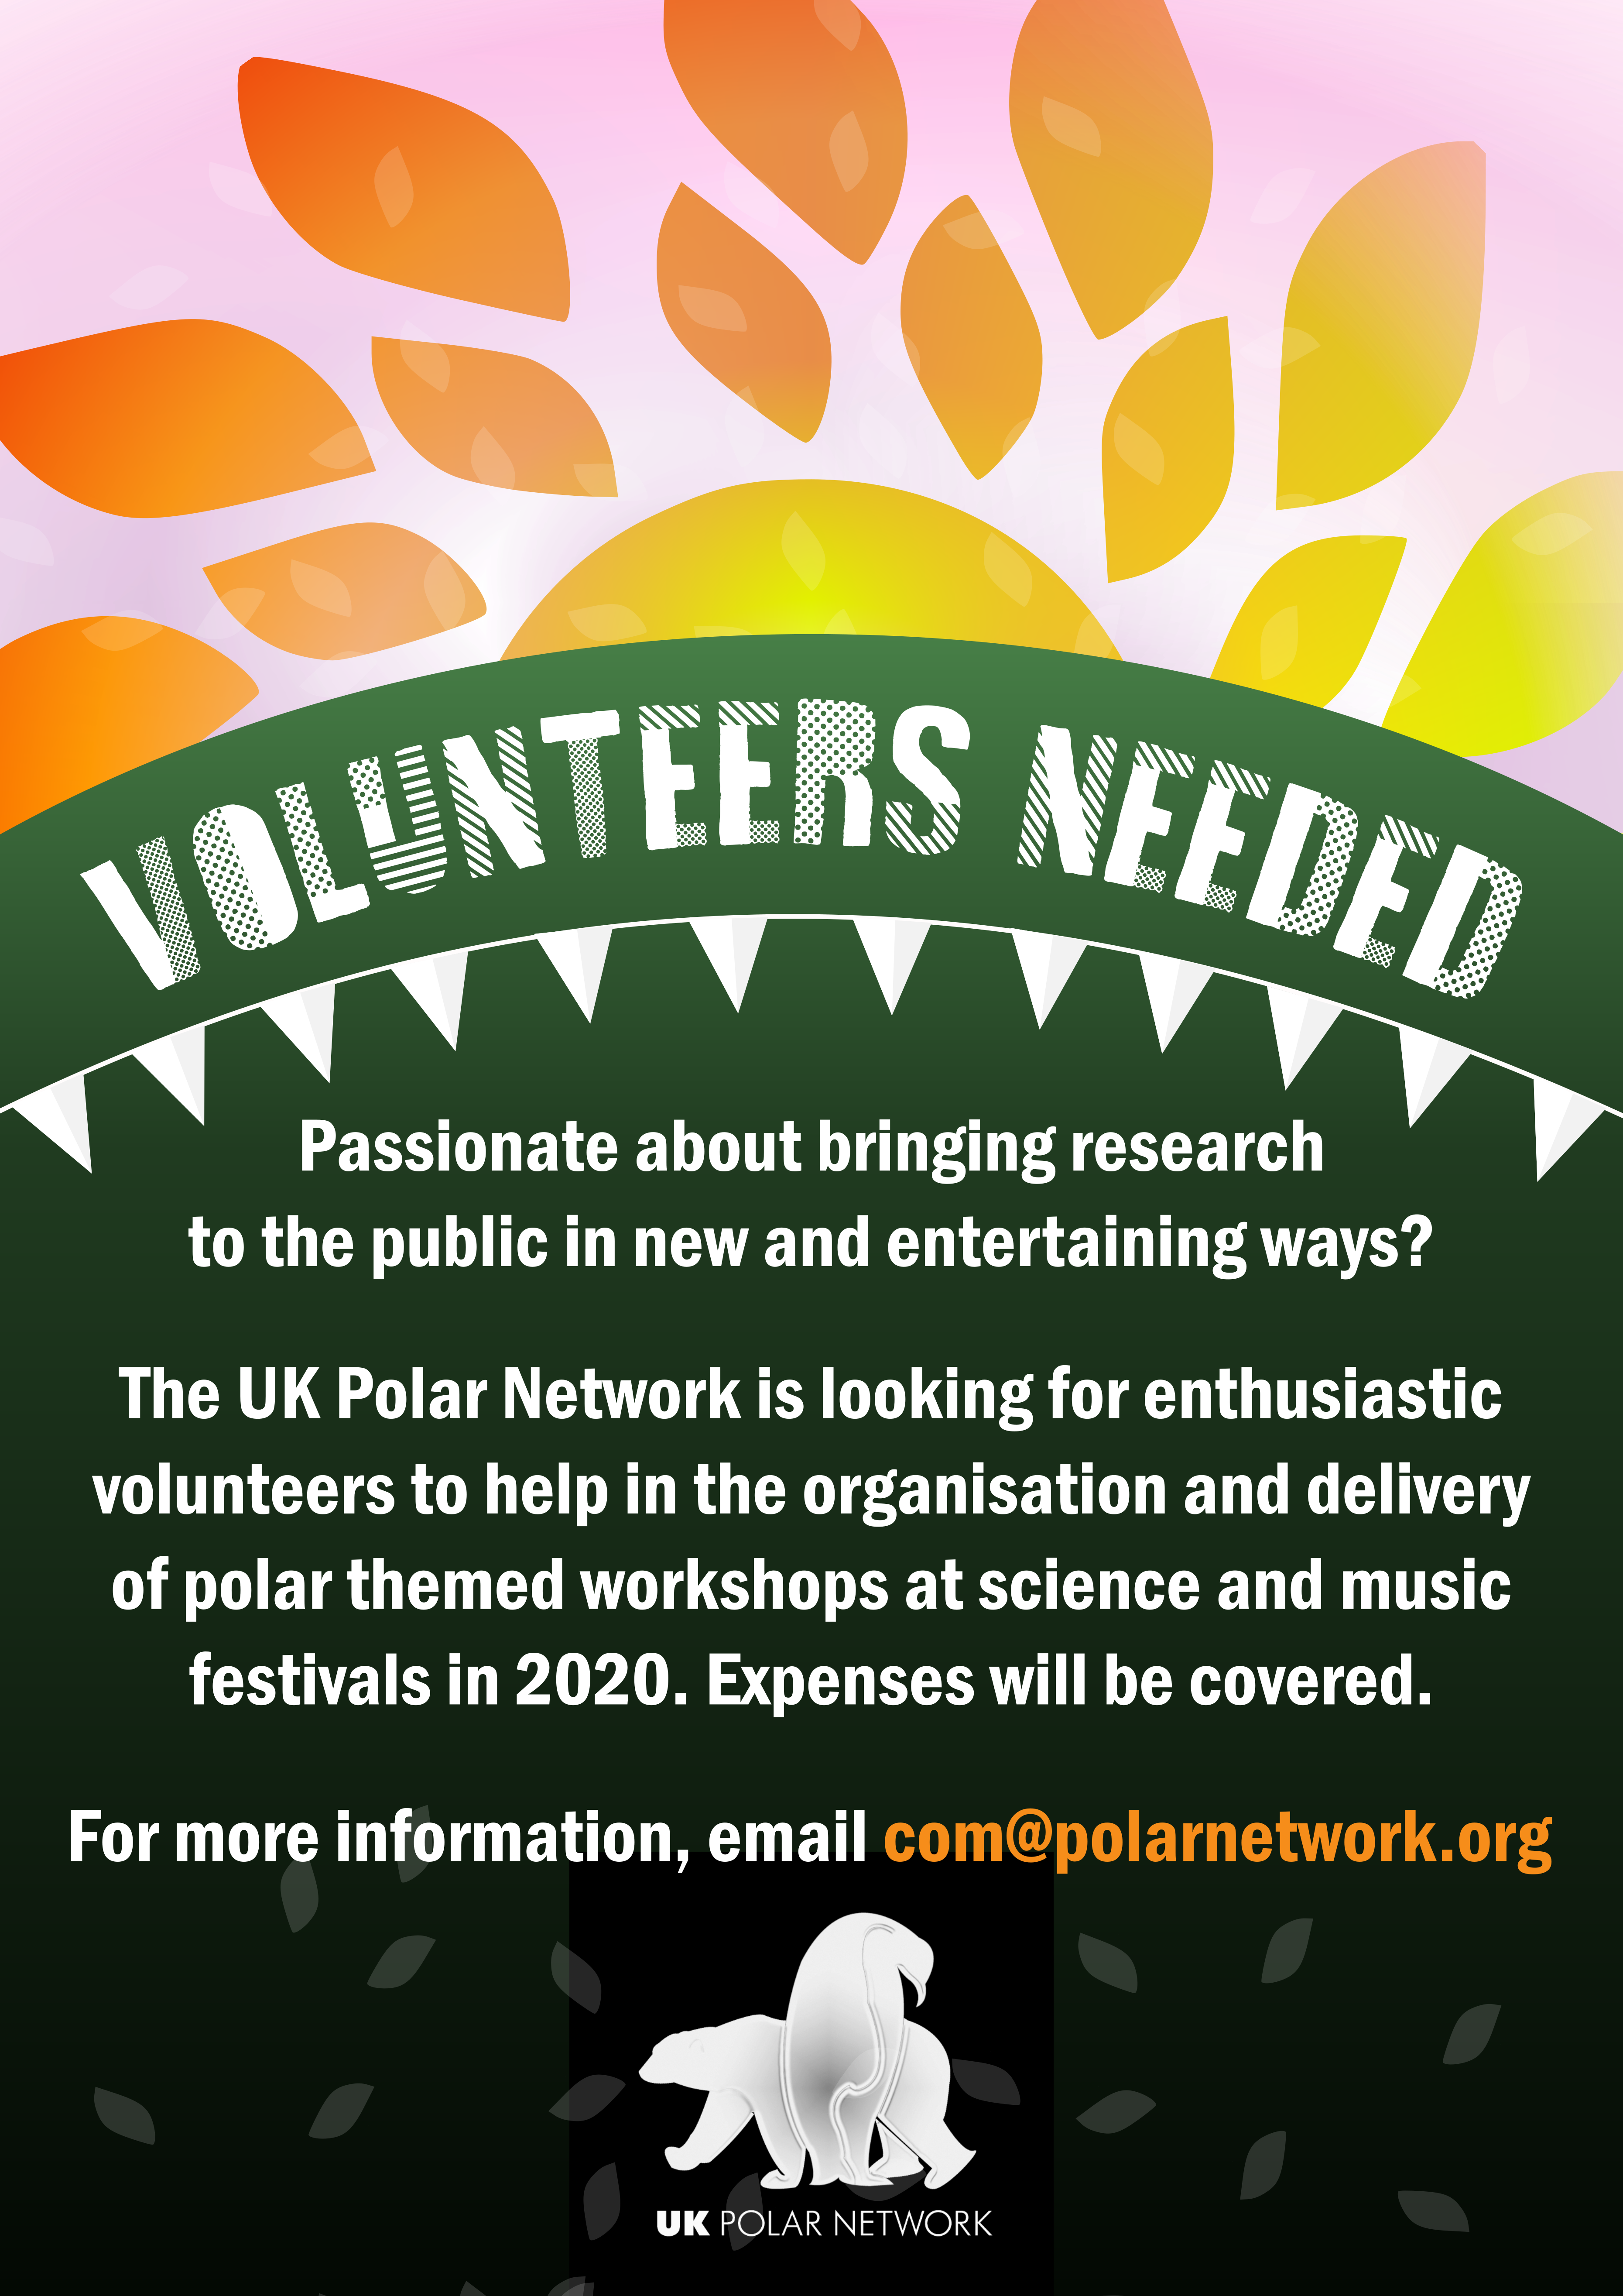
A selection of flyers, merchandise and a logo that I designed.
A basic I have used a lot during my PhD – a simple Arctic food chain.
